Data Analytics
Data Analytics Components and Dashboards
Draft 1.22.2025
Version 1 of the Data Analytics Components is in Beta Testing.
For now they will only be added to limited sites, but if you are interested in being a tester, or eventually in adopting these tools, you can contact Eric at emittelstadt@legalserver.org.
Pricing for Data Analytics is yet to be determined, but there will be some cost.
____________________________________________________________________________________________
In this Article:
- Supervisor Dashboard and Components
- Grants Management Dashboard and Components
- Disaster Dashboard and Components
- Administrative Set Up and Controls
____________________________________________________________________________________
Each of the dashboards described below has been organized on a home page view and is viewable by selecting it as your home page under “My Preferences” under your name in the upper right of LegalServer. Separate components may be added in different places in LegalServer. More information on Administrative set up and controls can be found below.
Supervisor Dashboard Components
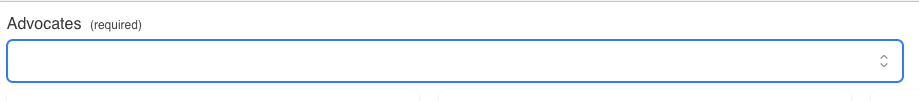
In the top left corner you will select an advocate whose caseload you wish to review:
Early Warning System (EWS) Components
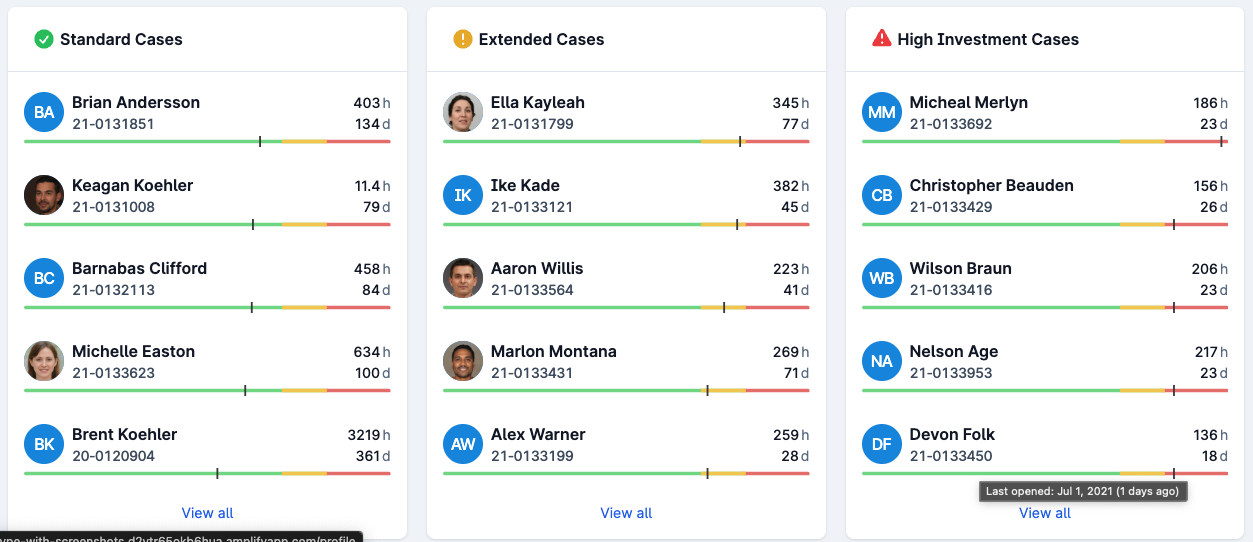
The EWS displays a comparison of the current case and caseload against the historical cases in three categories: Hours (Time Spent per case), Time (Length of Time Open), and Dollars (Funding Spent per case.) Cases are further divided by Short Term and Extended Term Cases, when that data is available (most often recorded in “Current Level of Service” in open cases and drawn from Closure Reason for Closed Cases.)
The visual displays the top 10 cases (if there are 10 in that category), that are nearest to moving to the next category. Standard Cases are in the typical range (green), Extended cases are cases that are moving beyond the norm (yellow), and High Investment Cases can be considered Outliers - cases that are taking much more time, or are open much longer, than a typical case in this category.
There may be perfectly good and legitimate reasons a case is in each category. The purpose of the EWS is to ensure staff and supervisors are aware of the status of each case, and can easily review a caseload.
Each case displayed is a clickable link to that case. Clicking the “View All” link takes you to a listview of all the cases in that particular category.
On each individual case, the visual displayed is:
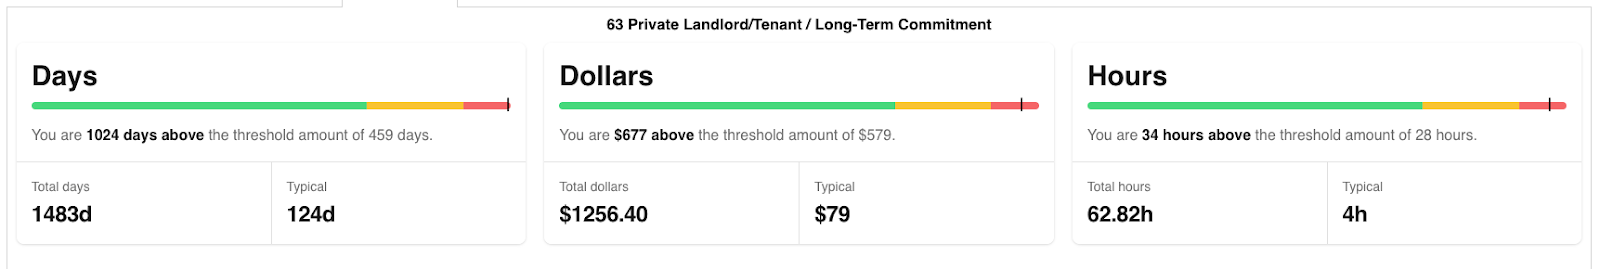
This case specific visual information is most often added behind a tab on the case profile. Each component allows you to see how this case compares to similar cases for the single metric displayed.
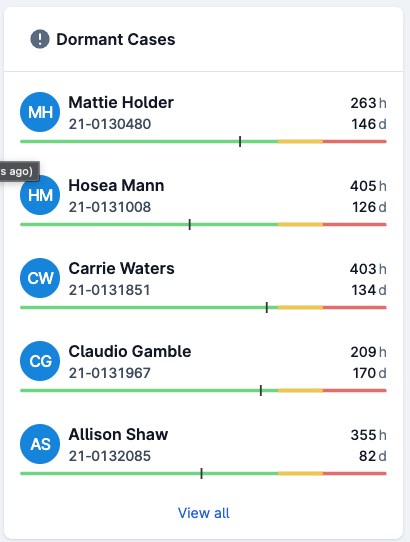
Also displayed on the dashboard is a “Dormant Cases” component which displays cases which lack recent case notes or time entries, similar to the “Aged Case Report” available in LegalServer.
Next on the dashboard you’ll see another filter which allows selection for either an advocate or a Legal Problem Category. Multiple advocates can be selected, but only one Legal Problem Category at a time.
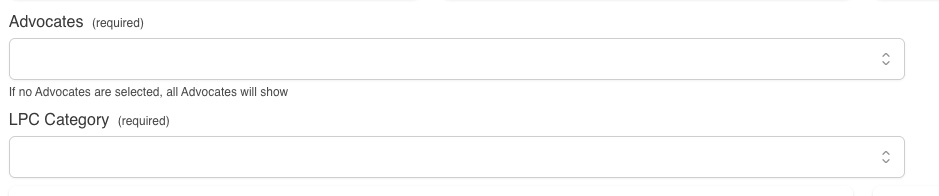
These filters control the visuals below:
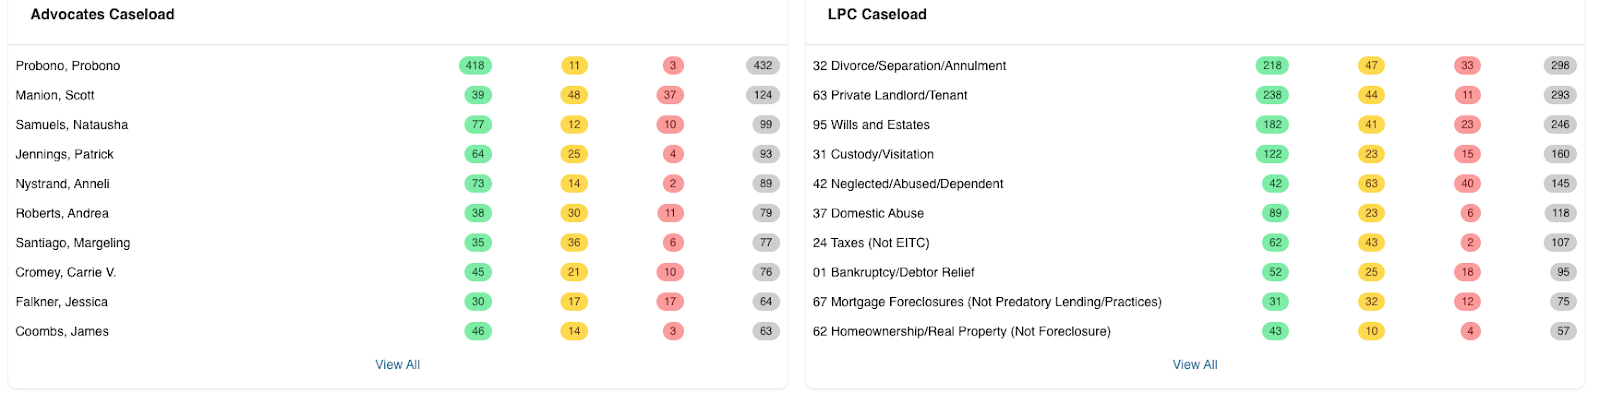
which can display caseloads by advocate for multiple advocates, and the cases they are currently assigned to, or alternatively can display the cases of an entire Legal Problem Code category for supervisors responsible for a certain practice area.
Grants Management Components
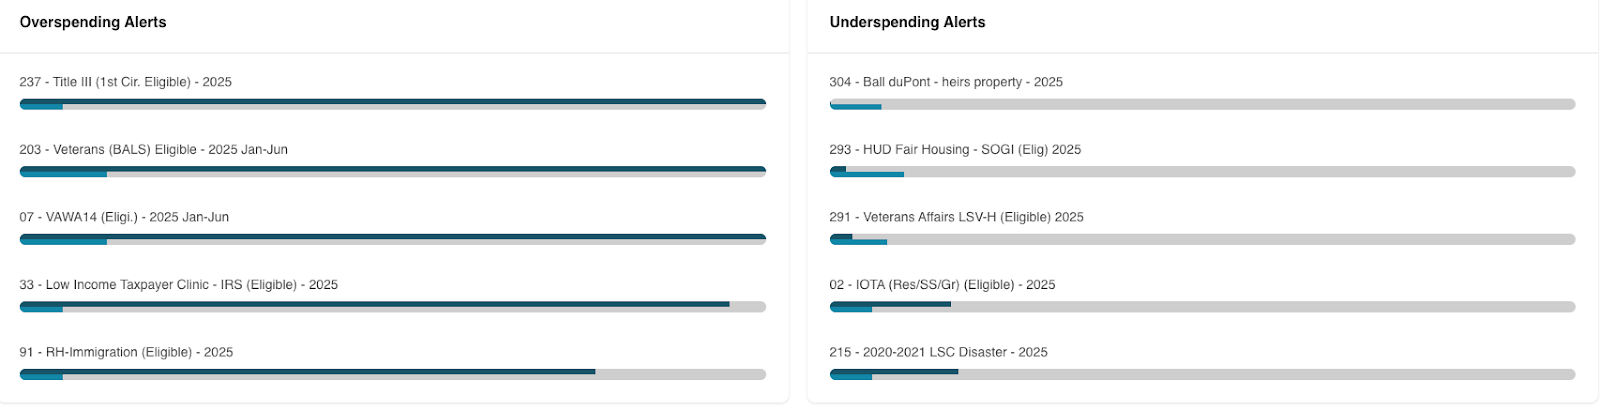
The initial display on the grants management dashboard shows grants which are being over or under spent. The top bar shows the spending on that grant, with the bar immediately below showing the time expended in the grant period. In the visual above, under “Overspending Alerts”, you can see that the Title III grant has been fully spent, although only a small amount of the time period of the grant has passed. Under “Underspending Alert”, at the bottom of the display you see that for the LSC disaster grant more time has passed in its grant term, but very little time has been billed to that fund.
Next on the dashboard you will see a filter where you can select an individual grant, and two years for which you want to compare grant spending.

If you select two prior years you’ll see below a graphic comparing the spending on that grant displayed as two lines that show spending by month through those years. If you select the current year, you’ll see spending “year to date” for that year.

If the later year’s spending is increased in comparison to the prior year selected, you’ll see a green badge showing the percentage increase in spending. A red badge indicates that spending in the later year selected was less than the other year selected.
Clicking the “Details” link opens a slide out showing amounts by month with the percentage change for each month displayed.
Finally at the bottom of the dashboard you’ll see a filter to select a grant to be displayed for “Funding Distribution”

This visualization displays where funds are spent by Legal Problem Code Category, Legal Problem Code and Special Legal Problem Code.
Clicking on the Legal Problem Code Category will change the Legal Problem Code Display to that category. Clicking on one of the Legal Problem Codes in the center column will change the display of the Special Legal Problem Code to that LPC. Dollar amounts representing the funding spent in each category are displayed.

Disaster Dashboard Components
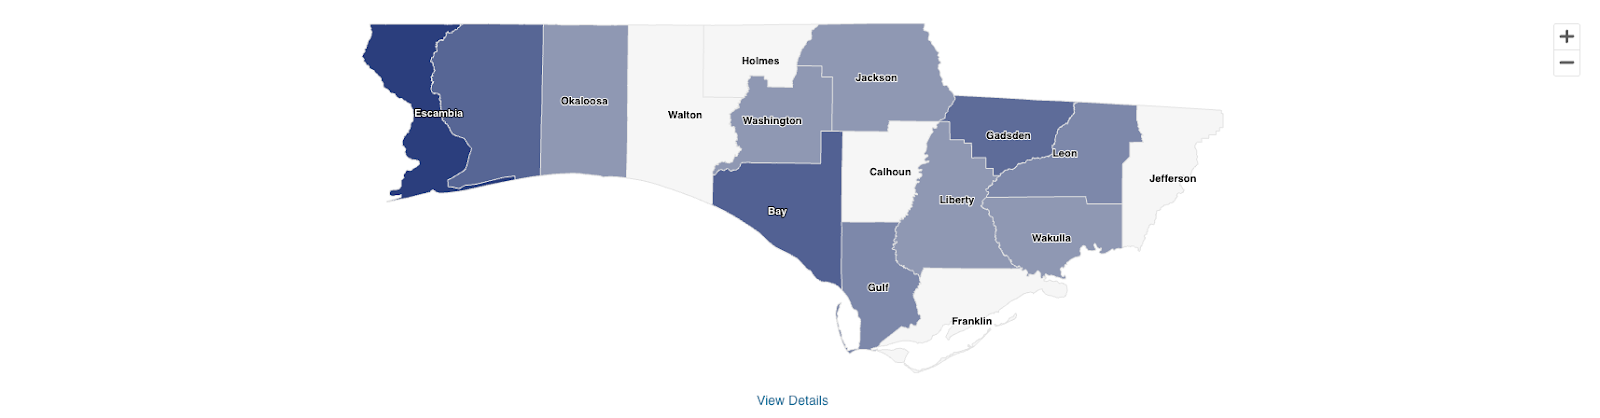
The top component in the Disaster Dashboard is a heat map showing where disaster related cases and outreaches are being handled in your service area. Clicking on an individual County will show you where services are occurring within that County. Clicking on “View Details” takes you to a listview of the data being displayed on the map.
Below the map you’ll see totals for area selected:

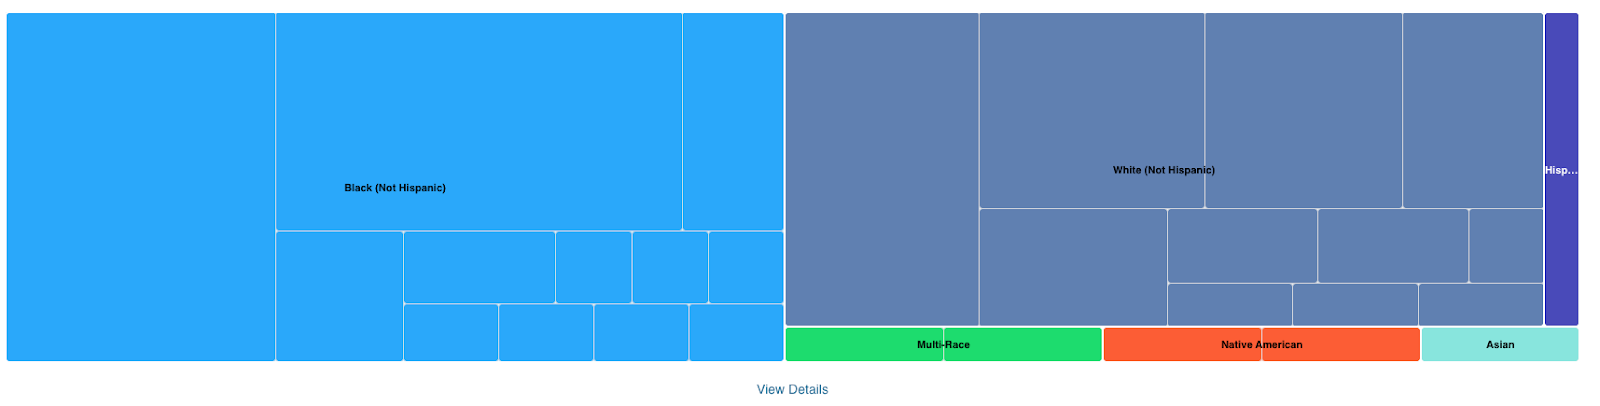
Below the map you’ll find demographic information on those being served displayed in a tree map. You can click into each visual to see additional information. The first demographic displayed is Race:
If you click into one race area, you’ll see a breakdown of the cases by Legal Problem Code handled for that demographic.
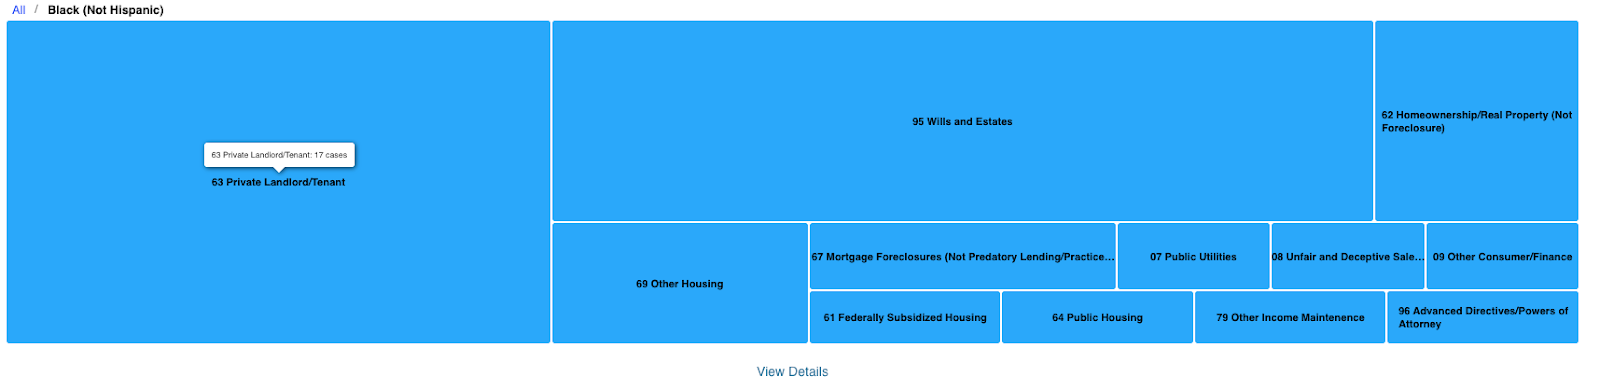
View details takes you to a listview of the cases in that category.
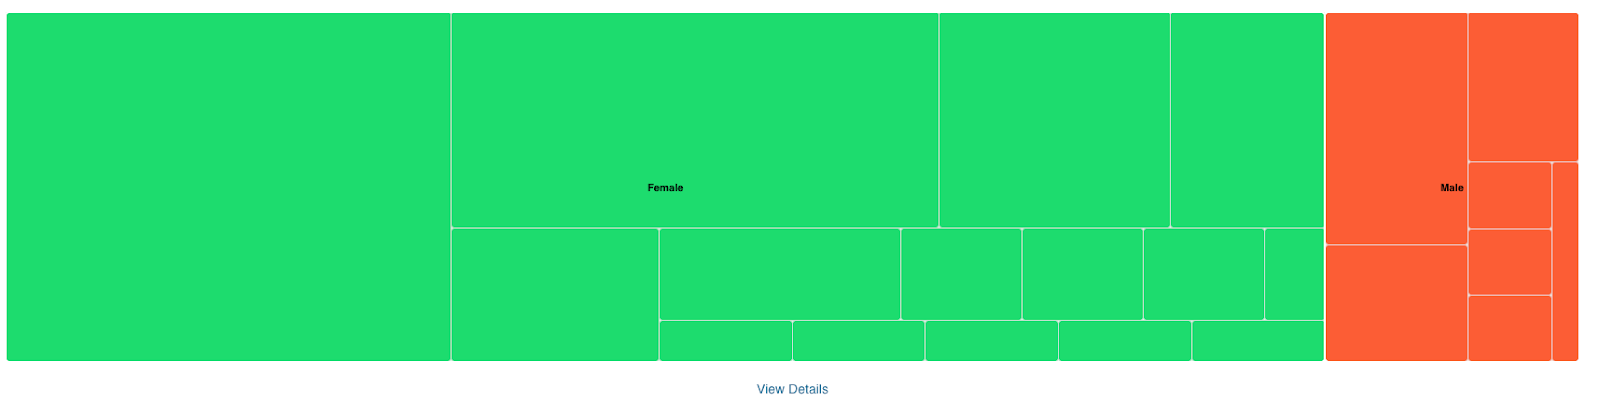
Gender is the other demographic currently displayed:
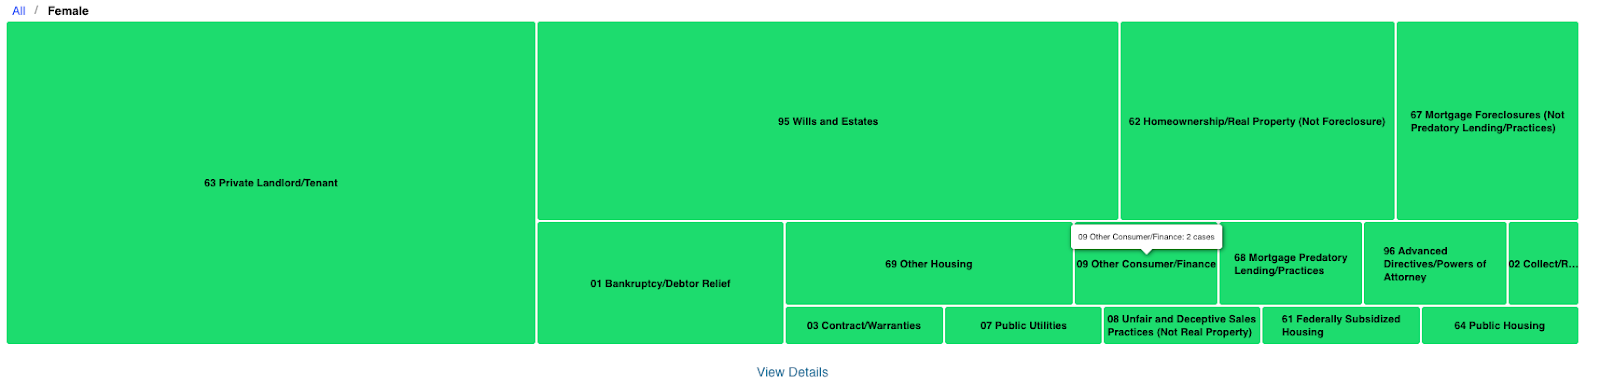
Click “All” to return to the original display.
Administrative Set Up and Controls: Coming soon.
We did mention this is just in Beta testing for now, yes?
(Admin>LS Data Analytics)
(Admin>LS Data Analytics Recalculation Configuration)